
All through out my career in SAP as an ABAP developer, I admit that programming or debugging in SAP Workflow was very rare and seldom that I encountered it in my work. It was then a fortunate time, after 2 years, when one of my projects is using workflow to process its asset posting. I was so lucky then that one of our programmers is an expert in working with workflow which I did not hesitate to take the opportunity to ask so many questions with regards to Workflow especially in debugging. Many of us for sure, especially for first timers, who were assigned to debug a Workflow came across a situation where debugging of workflow was not an easy task or I say at least your break-point was triggered as an attempt to be able to have a peek if what is really happening on the variable that you think is the culprit of your problem! If you are currently looking for the solution, I can say that you landed to the correct page and you are very fortunate since, I was able to perfect and master this debugging dilemma in Workflow environment.
So to start with, there are two types of debugging techniques that I know so far at least in a faster way especially for beginners. These are:
1. Through tcode SWI1 logs and
2. Through background process deactivation
Okay, without any further ado, let's begin with no. 1 - debugging through SWI1:
The first thing that we need to do is to see it that the transaction that needs to be checked includes workflow process, otherwise there will be no logs available in SWI1 for that specific process you are supposed to debug. Okay, so assume that you have a valid workflow process, you may now run tcode SWI1 after running your process or transaction. Below is the screenshot of SWI1 log initial screen:


So, let us say that you are aware of the item that you are looking for, you should then select it and proceed by clicking the workflow log icon :
The first thing that we need to do is to see it that the transaction that needs to be checked includes workflow process, otherwise there will be no logs available in SWI1 for that specific process you are supposed to debug. Okay, so assume that you have a valid workflow process, you may now run tcode SWI1 after running your process or transaction. Below is the screenshot of SWI1 log initial screen:
Then, you may enter the IDentification if you know it, otherwise just proceed if you are just minutes away before landing on SWI1.

Below, depending on your default setting, a workflow log will appear as the below view:

As with my preference, I usually view this on a List with Technical details and this can be found by clicking the second icon on the taskbar.


Double click the object type to view the class methods as shown below:

In our example, double click the read_step_occurence to view the ABAP code and you may now look for the line of codes that you may want to put the break-point into.

Okay, I can see now the smile on your face, if not don't worry as we are not yet finished! :)
To start with the actual debugging, let's go back to the workflow log with technical details and look for the request ID generated. This can be found in the container tab and this request id assignment in the workflow container varies from the design of your application:

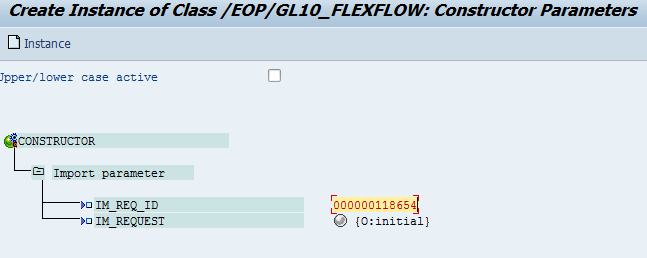
After the instance has been created, you may now run the method of the task and make sure it is where you put your break-point on.

By clicking the above icon, you are then required to enter some parameters to process your debugging correctly.

You may now generate the debugging screen by clicking any one of the clock icons above.
ABS_REQ_EE can be found also in the container together with the REQID.
Then, voila! your break-point is now triggered.

Enjoy and please don't forget to share or like!
Background process: In this case, the break-point should be triggered when running your actual tcode or program and not inside SWI1 unlike the other process above.
1. Put a breakpoint to the method in BOR where being processed by the workflow
2. Double check the particular task where you set the break-point and where the method belongs to.
3. Inside the task, uncheck the background processing
3b. Uncheck the dialog check box when you double click the method in bor
4. Click binding or as long as the agent will become editable. 5. Change the agent fields to User then put your account ID adjacent.
6. Save and Activate the workflow.
Test:
To test, perform your project and after processing it, there should be a workflow item in your inbox - click it and the debugging window should now appear and stop to your break point.
NOTE:
1. If agent field still not editable when unchecking the background check box then you may run swu_obuf to refresh, log-off - log-on or to uncheck and check other checkboxes.
2. Make sure to edit the updated workflow version.


